 There's no doubt that the past decade or so has been hugely challenging for educators and for the public schools where they teach. From the failure of No Child Left Behind to the devastating budget cuts following the Great Recession to the vilification of the teaching profession stirred up by the education reform movement, it's clear why public education advocates hope the next ten years is more promising.
And yet, for many aspects of the teaching profession, the more things have changed, the more they have stayed the same, at least according to new federal data contained in the 2014 Digest of Education Statistics, released in May by the National Center for Education Statistics (NCES). A wide variety of subjects are covered, including funding, student enrollment, attitudes on education, demographic profiles, international comparisons. There's also quite a bit of information on public school teachers - who they are, where they work, what they teach, and what they earn - and the trends that have shifted (or not) over the past decade or so. Here are just a few takeaways from the data:
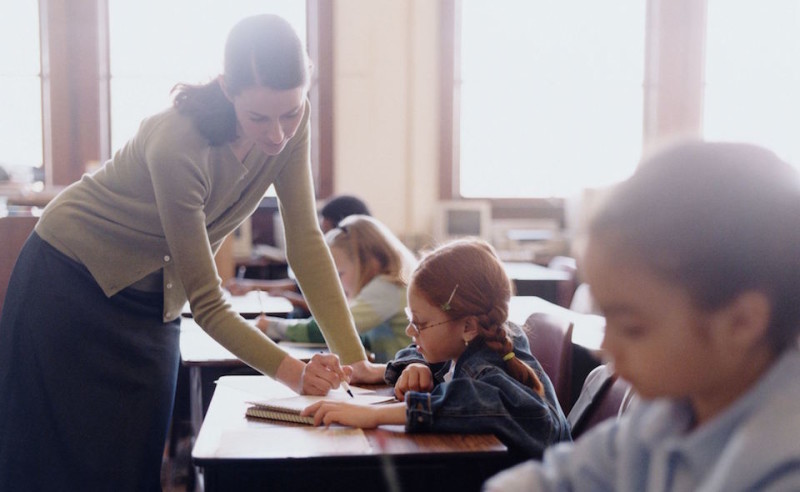
1. If you are a classroom teacher, you are still probably a White female. In 2011-2012, there were approximately 3.2 million public school teachers in the United States, a marginal increase from just over 3 million in 2000 and slightly less than the 3.4 million in 2008 just before the country was slammed by the Great Recession.
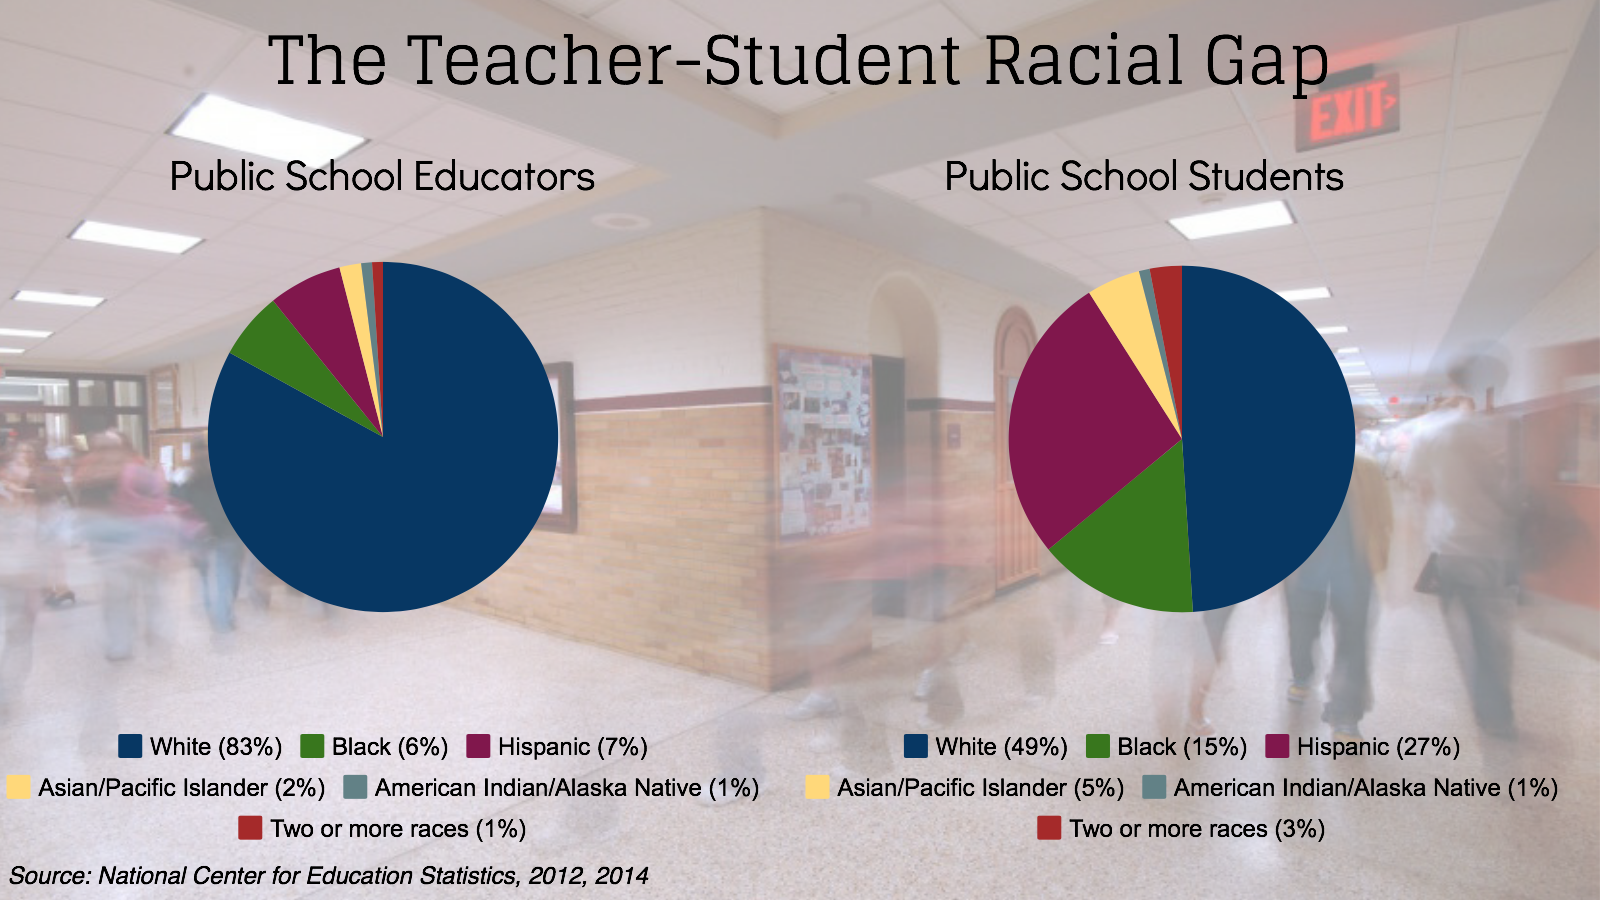
The gender and racial disparities in the profession persist. In 2000, 84 percent of teachers were White, dipping slightly to 83 percent in 2012. During that time period, the percentage of Hispanic teachers increased the most to around 7 percent. The year 2014 marked the first time White students did not represent a majority in the nation's public schools, calling more attention to the wide representation gap between educators and their students.
Teaching is still an overwhelmingly female profession. In 2012, 76 percent were women, a slight increase over 74 percent in 2000.
2. The profession is both grey and green...for now. In the 2012-13 school year, 12 percent of teachers had only 1-3 years full-time teaching experience, an uptick from 9 percent the previous year. Over this one-year period, however, those educators with more than 20 years under their belt also increased by 4 percent to 21 percent. Between 2008 and 2013, the number of teachers age 60 and over declined marginally as many in that age group are retiring, a process that Prof. Richard Ingersoll of the University of Pennsylvania says signals the end of what he calls the "greying of the profession."
Teachers today are also more likely to have earned an advanced degree. In 2012, 56 percent hold at least a masters degree, compared to 47 percent in 2000.
3. U.S. teachers spend a lot of time in the classroom. The NCES data also looks at international comparisons of the teaching profession, culled from OECD reports. In 2012-13, U.S. educators spent more hours teaching in the classroom than teachers in almost every other OECD nation. For example, the OECD average number of hours spent in the classroom per year for lower elementary or middle school teachers was 694 hours. In the United States, that total increases to 981. The number of actual teaching hours in the classroom measures just that – teaching hours in the classroom, not time spent preparing lesson plans, assessing students, participating in professional development, collaborating with colleagues, or other non-teaching activities. Comparing the number of teaching hours between countries is more an exercise in comparing demands placed on educators and how their time is spent either teaching or preparing to teach.
4. Views on teaching and school conditions are constant, with one exception. Comparing data from 2000 and 2012 reveals few changes in attitudes on many of the issues educators face every day in school. For example, there is little variability in responses to questions regarding level of cooperation among school staff (generally high), concern over how routine tasks interfere with teaching (also high) or how satisfied teachers are with level of parental involvement (middling). (It's worth noting, however, that much of the NCES data on this topic relies on the Schools and Staffing Survey, which, some critics say, provides an incomplete picture of teacher attitudes toward their profession.)
The widest disparity between 2000 and 2012, however, can be seen in responses to the statement, "I worry about the security of my job because of the performance of my students on state or local tests." Not surprisingly, that number spiked from 28 percent in 2000 to 45 percent twelve years later.
 5. Teachers are now much more likely to believe poverty is a major problem. Educator views on the serious issues facing their schools also haven't shifted a great deal. Lack of parental involvement, absenteeism, student health and preparedness to learn all scored reasonably high in 2000 and 2012. (Although the data does not include recent educator responses to the level of school crime, student victimization has declined significantly over the years. Between 1992 and 2014, the total victimization rate at school fell from 181 victimizations per 1,000 students in 1992 to 33 victimizations per 1,000 students in 2014, according to NCES data.)
The percentage of teachers who view poverty as a serious issue facing schools increased 30 percent from 2000 to 2012. The largest jump occurred since 2008, obviously corresponding with the increasing numbers of public school students eligible for free or reduced-price lunch, which topped 50 percent in the 2012-13 school year.